Maximize the performance of Schema Markup across your website
Use Schema Performance Analytics to track the performance of your Schema Markup efforts and inform your Schema Markup strategy

Track your Schema Markup Efforts
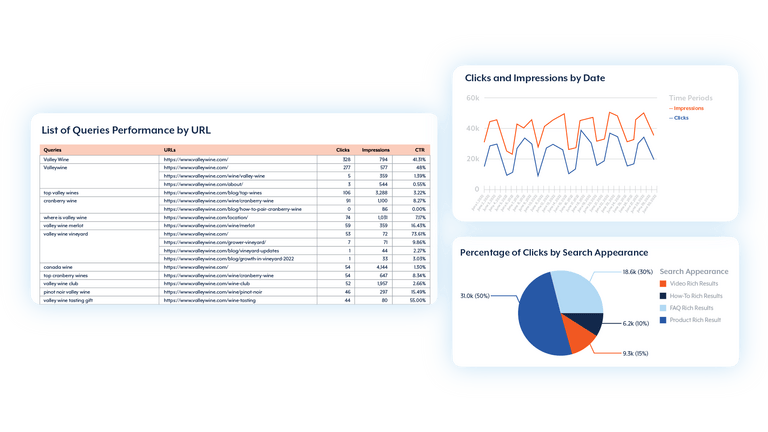
Visualize your entire Schema Markup performance journey. SPA provides users with insights into their content’s clicks, impressions and click-through rates over months, quarters, and years.
360° View of Performance Data
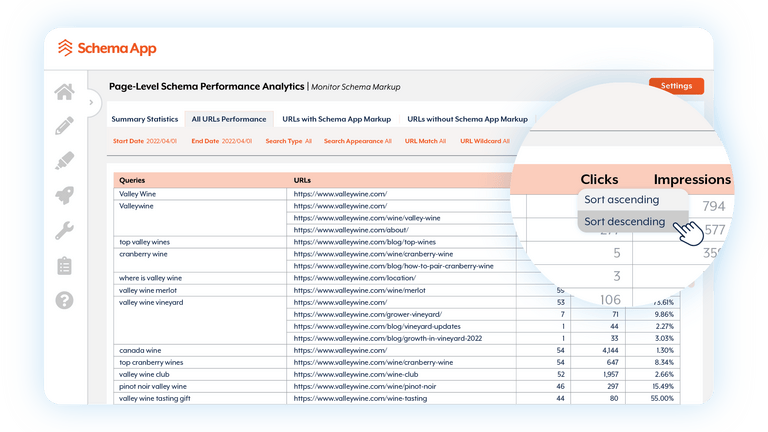
View content performance on SPA through dimensions such as date, page, query, rich results and Schema App Template to get a 360 view of your Schema Markup performance.


Identify Opportunities Within your Schema Markup Strategy
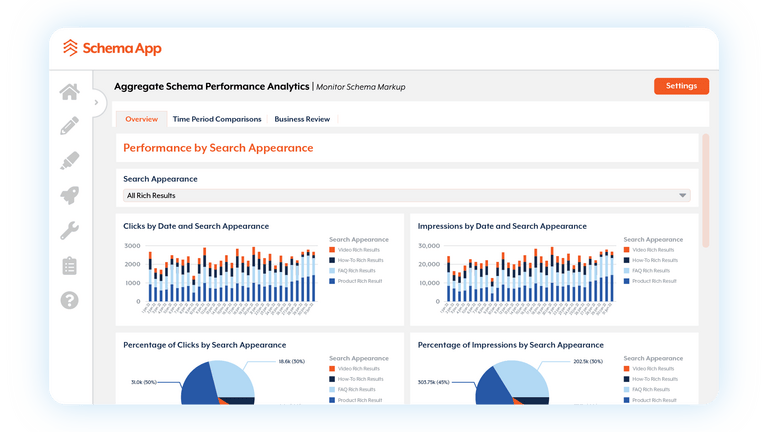
See your mix of rich results and identify opportunities to diversify your search appearances and inform your content strategy moving forward.
Enable Stakeholder Reporting
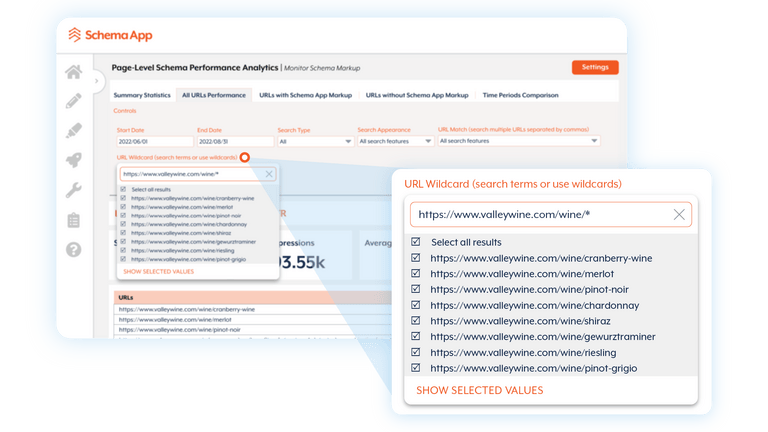
Drill down into the Schema Markup performance of specific URL groups, departments or lines of business on SPA, using our URL wildcard filter and report on the metrics to relevant stakeholders within your organization.

Frequently Asked Questions
Schema Performance Analytics (SPA) is an interactive analytics reporting tool that allows all Schema App enterprise customers to monitor, analyze, and gain insights into their website or specific line of business’s Schema Markup performance.
SPA combines data from Google Search Console and Schema App’s Highlighter and Editor to provide customers with more customizable reporting and a 360 view of their data to gain insights for content strategy and return on investment.
Google Search Console (GSC) is a platform offered by Google to help webmasters monitor the search performance of their sites.
The key differences between Schema Performance Analytics and Google Search Console
- Data limitations
- GSC only allows users to export 1000 rows of data per query – which can cause marketers with a huge website to miss out on a lot of useful query data.
- SPA allows users to export their entire data set and every single query for more granular analysis.
- Data Retention
- GSC only stores and processes 16 months of data at a time – This means that users can only view 16 months of historical data on the platform unless they export the data.
- SPA stores and processes historical data from 16 months prior to the day SPA is setup (integrated with GSC) and activated, to the present date.
- Additional Dimensions
- The GSC dimensions that users can query are date, page, query, search Appearance, device and country.
- The SPA dimensions that users can query are date, page, query, search appearance, schema app template, and country.
- Data View
- In GSC, the data for the query and page dimensions are separated – If users want to see the queries for each page on GSC, they’ll have to first click on pages, select the page, and then click on the Query tab. They’ll have to do this on a page-by-page basis.
- In SPA, users can layer on a secondary dimension and see the query data for every page in a single view. They can also filter the data by search appearance, search type, date, and more.
Schema Performance Analytics is available for Schema App Enterprise Customers. If you are currently a Schema App Enterprise Customer, please contact your Customer Success Manager to set up SPA.
If you would like to learn more about our Schema App Enterprise solution and SPA, get in touch with us today.
The performance metrics in Schema Performance Analytics include:
- Impressions
- Clicks
- Click-through rate (CTR%)
The standard dimensions in Schema Performance Analytics include:
- Query
- Search Appearance
- URL
- Schema App Template
- Date
The data filters in Schema Performance Analytics include:
- Date
- Search Type
- Search Appearance
- Specific URL
- Specific URL Wildcard
SPA stores and processes historical data from 16 months prior to the day SPA is set up (integrated with GSC) and activated, to the present date.

